Create Visualizations in no time


Data Panel - Search or browse for data to view and analyze.
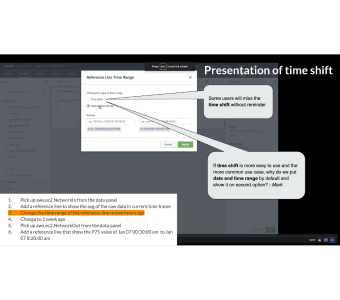
Time range picker - Select a common time range or define a custom time range to display for all charts.
Time span - User can change the span of time to see the data in different granularities
Aggregation - Charts in the Analytics Workspace contain time series based on aggregated data. To calculate aggregations, data points within the same approximate time frame are categorized into buckets. The aggregation list are: Average (Avg), Maximum (Max), Minimum (Min), Standard deviation (Std dev), Sum, Percentiles, Count, Dist Count
Reference line - Add reference lines to compare, reference, or highlight data on your charts. You can add one or more reference lines to your charts.
Split by - Split a time series by a dimension to view a separate time series for each dimension value. Splitting a time series by a dimension shows the dimension values with the highest or lowest data points for the selected time range.
Filters - Filter data by dimension to view specific dimension values in a time series. If a metric is already split by a dimension, use filters to add or remove time series for selected dimension values.
Y scale - User can adjust the Yscale in different use cases to see the changes of data
Charts - Two types of charts are available, time and categorical: Time charts(line, area and column) and Categorical charts(column and stack column)
Charts - Two types of charts are available, time and categorical: Time charts(line, area and column) and Categorical charts(column and stack column)
Alerting - Use alerts to monitor and respond to specific behavior in your data. Analytics Workspace alerts are based on a specific chart. Alerts use a scheduled search of chart data and trigger when search results meet specific conditions.
Multiple Export Options - Open in Search (Show the SPL that drives the chart's time series in the Search & Reporting App.), Search Related Events(View a list of log events that are related to any metric on the chart.) Save as Dashboard Panel, Save as Report, Export as PNG, Export as CSV
Grid layout or stack layout - Display charts in grid layout, which displays multiple charts in each row, or stack layout, which displays one chart per row.
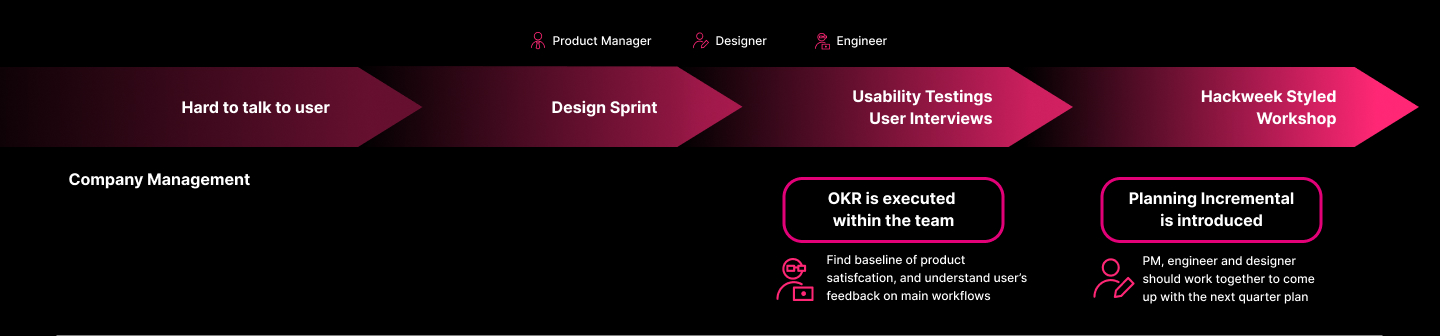

The first formal user research activity we did together. The goal is to invite people in different roles to discuss how analytics workspace can be in 2 years.
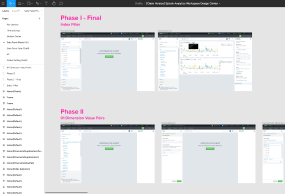
As a result, we have a problem statement, showcase different ideas on the market, come up with different product ideas. FInally we created a design prototype and test with 4 users to get their feedbacks. All of them are done in 1 week.
Problem Statement
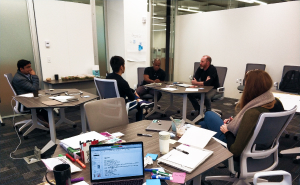
Product Manager, Engineers and Designers in one room
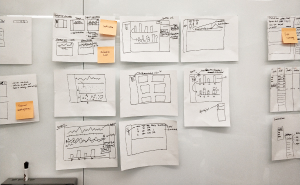
Design Pitching
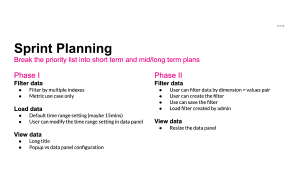
Main workflow Summary
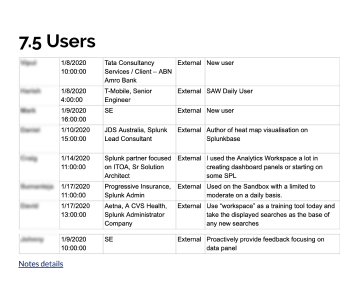
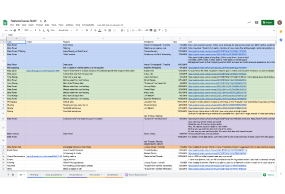
Interviewees List
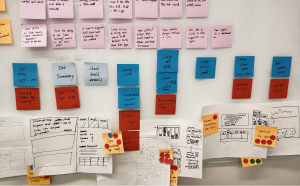
The team makes user research a regular team activities to collect user feedbacks on new released features and features developed or in planning and design stage.
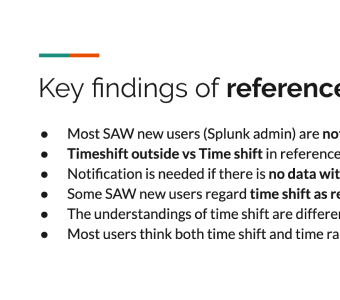
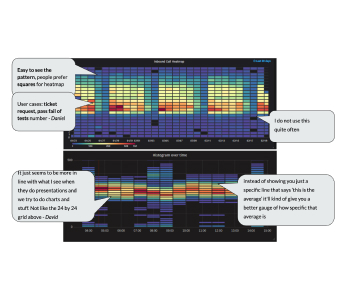
Key findings from the Usability Testings
User feedbacks on different features
User feedbacks on different ideas
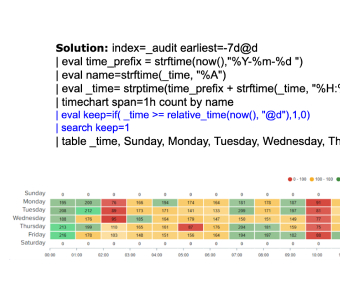
Users show their use cases
Lorem ipsum dolor sit amet, consectetur adipiscing elit. Suspendisse varius enim in eros elementum tristique. Duis cursus, mi quis viverra ornare, eros dolor interdum nulla, ut commodo diam libero vitae erat. Aenean faucibus nibh et justo cursus id rutrum lorem imperdiet. Nunc ut sem vitae risus tristique posuere.
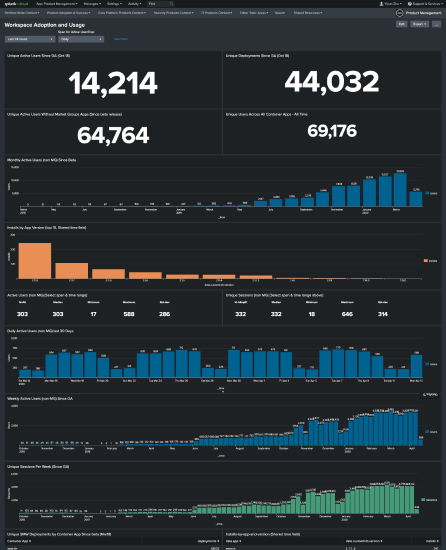
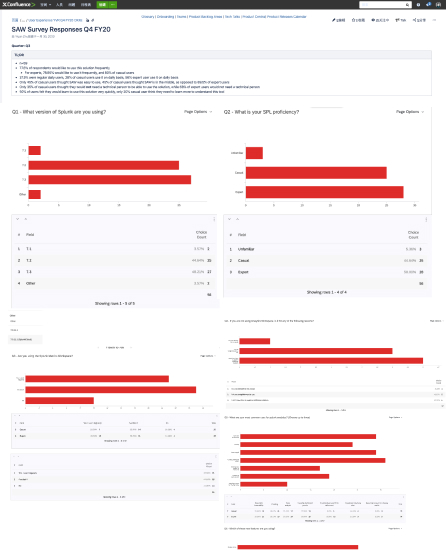
Our team use Splunk to create dashboard to monitor how user use analytics workspace. This real-time dashboard helps us learn which version is used by user, usage in day, week and month. Usage stickness and other measures.
Hack week styled workshop is a new user research method that our team tried.
The goal is to bring designer and engineer more close on new feature development.
PM, designer and engineer work together to brainstorm the complete design, engineer develop a quick demo including partial feature and test both complete UX design + implementation with users to understand the priority from user's perspective.
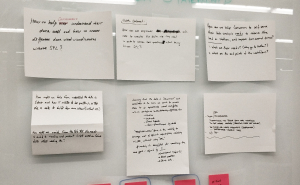
Collect pain points from users in history
Categorize pain points and discuss priorities
Design solutions
Change the top priorities into Jira tickets and follow up